
Table of Contents

Would you pack your bags and set off for a new adventure? But not for the sights or sunny weather, but for the chance to land a new, well-paid job. As the world evolves, demand for specialized skills and tasks beyond AI skyrockets, with certain states becoming hotspots for employment. From tech hubs to healthcare, the map of opportunity spans the entire country.
In this article, we’ll explore the fastest-growing jobs, showcasing projected employment growth from 2023 to 2033 and median annual wages. Plus, we’ll highlight the states where opportunities are thriving and examine the cost of living in these career hubs—helping you chart your course for the future.
Key insights:
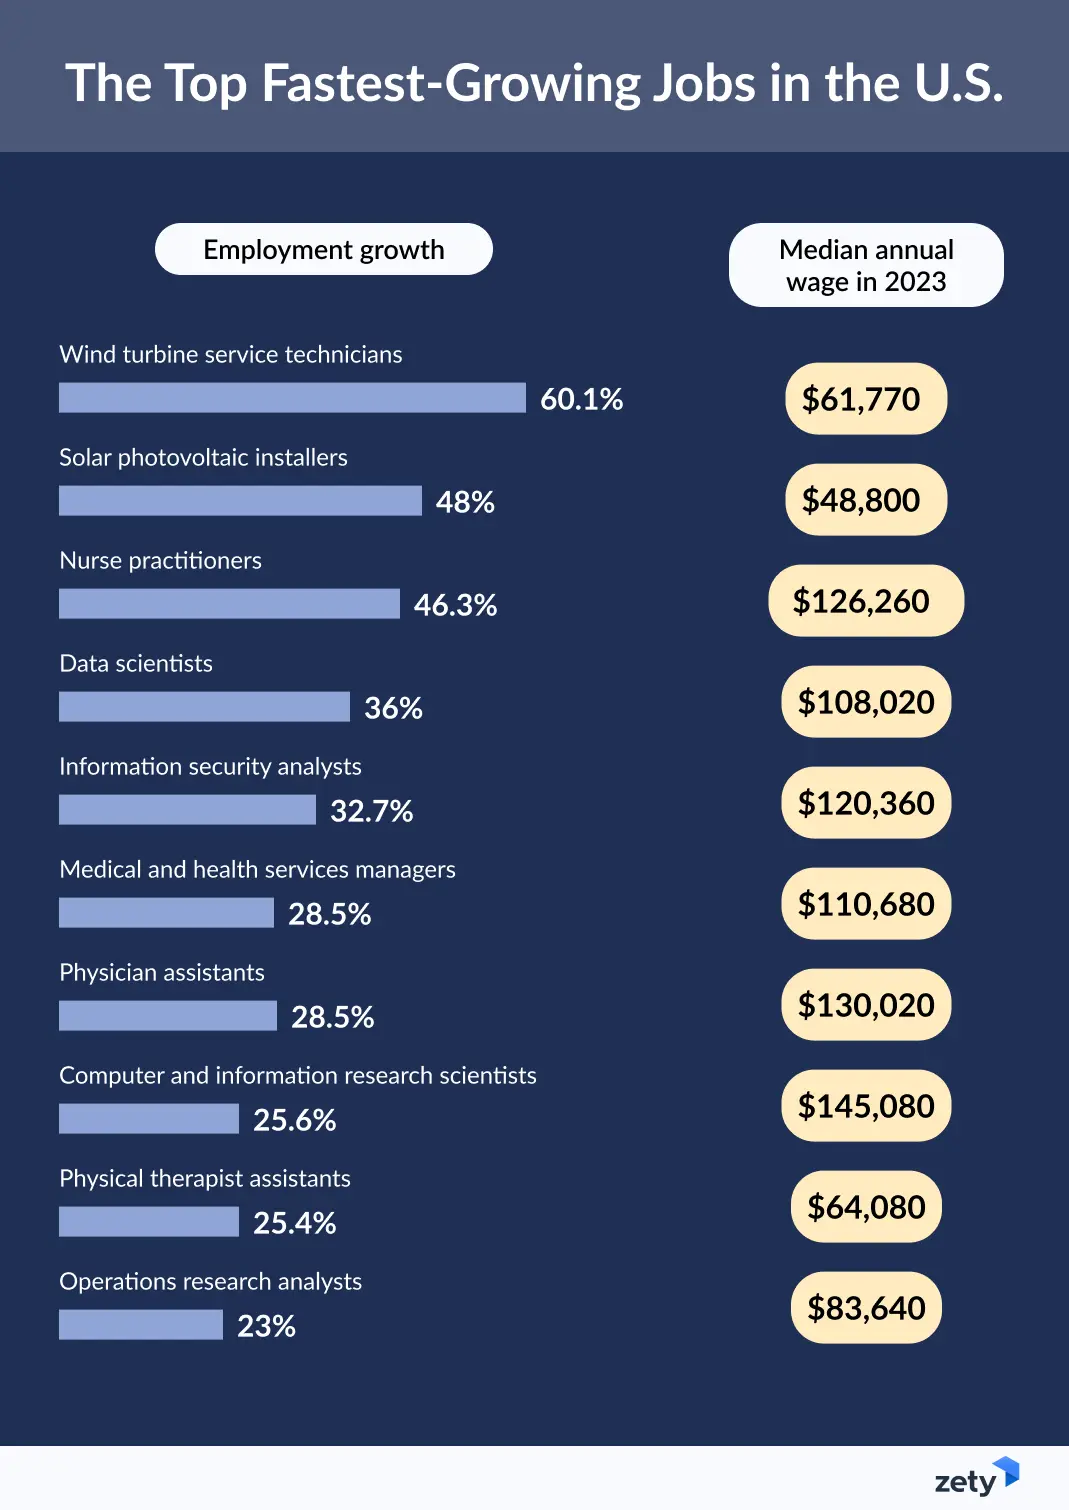
- The fastest-growing jobs include Wind Turbine Service Technicians, Solar Photovoltaic Installers, and Nurse Practitioners.
- The highest-paying roles among these fast-growing careers are Computer and Information Systems Managers, Computer and Information Research Scientists, Software Developers, and Physician Assistants.
- In terms of affordability, West Virginia, Kansas, and Mississippi top the list, while Hawaii, Massachusetts, and California are the most expensive states to live in.
The Top 30 Fastest-Growing Jobs
| The Top 30 Fast-Growing Jobs in the U.S. | ||
| Job | Employment growth in % | Median annual wage in 2023 |
| Wind turbine service technicians | 60.1% | $61,770 |
| Solar photovoltaic installers | 48% | 48,800 |
| Nurse practitioners | 46.3% | 126,260 |
| Data scientists | 36% | 108,020 |
| Information security analysts | 32.7% | 120,360 |
| Medical and health services managers | 28.5% | 110,680 |
| Physician assistants | 28.5% | 130,020 |
| Computer and information research scientists | 25.6% | 145,080 |
| Physical therapist assistants | 25.4% | 64,080 |
| Operations research analysts | 23% | 83,640 |
| Occupational therapy assistants | 22.3% | 67,010 |
| Actuaries | 21.8% | 120,000 |
| Financial examiners | 21% | 84,300 |
| Home health and personal care aides | 20.7% | 33,530 |
| Veterinary assistants and laboratory animal caretakers | 19.4% | 36,440 |
| Veterinary technologists and technicians | 19.3% | 43,740 |
| Logisticians | 19.3% | 79,400 |
| Veterinarians | 19.1% | 119,100 |
| Substance abuse, behavioral disorder, and mental health counselors | 18.8% | 53,710 |
| Epidemiologists | 18.8% | 81,390 |
| Health specialties teachers, postsecondary | 18.8% | 105,650 |
| Speech-language pathologists | 18.4% | 89,290 |
| Medical equipment repairers | 18.4% | 60,670 |
| Software developers | 17.9% | 132,270 |
| Nursing instructors and teachers, postsecondary | 17.9% | 80,780 |
| Massage therapists | 17.7% | 55,310 |
| Computer and information systems managers | 17.4% | 169,510 |
| Industrial machinery mechanics | 17.2% | 61,420 |
| Personal financial advisors | 17.1% | 99,580 |
| Psychiatric technicians | 17.1% | 39,700 |
When analyzing these professions, clear patterns emerge, allowing us to group them into five distinct industries: Health Services and Care, Veterinary and Animal Care, Computer Science and Technology, Industrial and Technical Maintenance, and Financial and Business Services.
What sets them apart is their reliance on uniquely human skills and personal touch that are difficult, if not impossible, to replace with AI or automation. Many of these jobs demand a combination of physical or on-site work, interpersonal interaction, creativity, and critical thinking—qualities that machines and algorithms struggle to replicate.
The Best States for Fastest-Growing Jobs
- 2022 The US Census Bureau reported that 8.2 million people moved between the states, increasing from almost 7.9 million in 2021.
- The 2023 Moving Migration Report reports that move volume (the number of individuals that moved in 2023) decreased 12% compared to 2022.
- According to the same study, the top inbound states in 2023 were South Carolina, Tennessee, North Carolina, Arizona, and Florida.
- The top outbound states in 2023 were Illinois, California, Pennsylvania, Minnesota, and Washington.
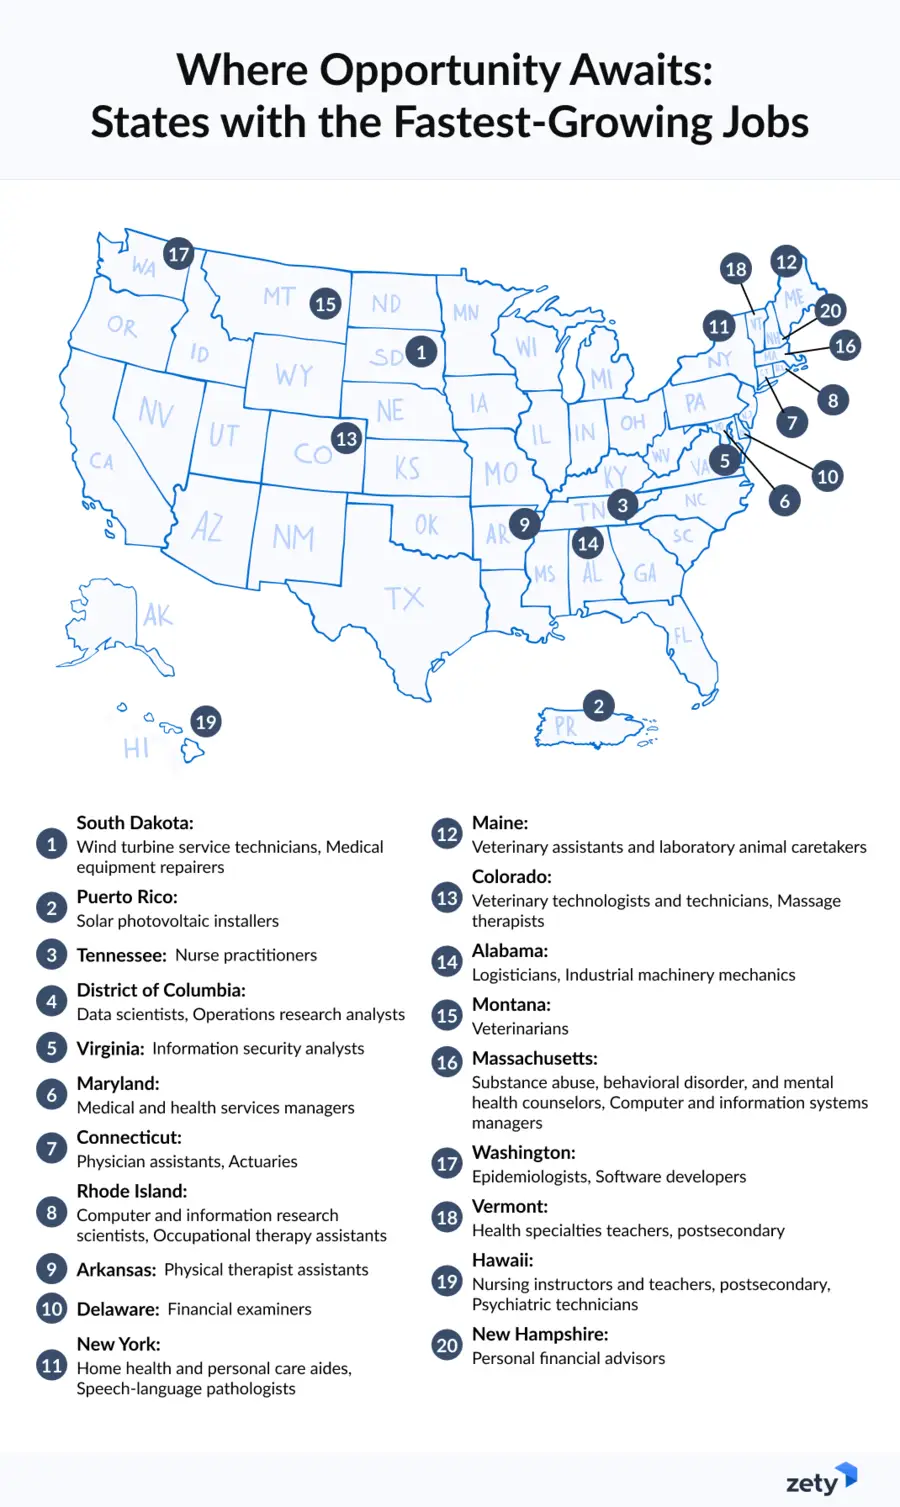
To rank the top states regarding employment opportunities for our fastest-growing jobs, we used Location Quotient (LQ) to measure how concentrated a particular job is in a specific area compared to the entire U.S. workforce. It shows whether an occupation is more or less concentrated in a particular location.
LQ = 1: The occupation’s share of local jobs matches the national average.
LQ > 1: The occupation is more concentrated locally than nationally.
LQ < 1: The occupation is less concentrated locally than the national average.
1. Wind turbine service technicians
The top states with the highest concentration of jobs in this field: South Dakota (12.51), North Dakota (11.43), Iowa (7.14), Oklahoma (5.1), Kansas (4.16), Texas (4.07), Wyoming (3.66), New Mexico (3.14), Colorado (2.48), Minnesota (1.8).
2. Solar photovoltaic installers
The top states with the highest concentration of jobs in this field: Puerto Rico (8.62), Hawaii (3.47), Vermont (3.01), Arizona (2.96), California (2.63), Utah (2.36), New Jersey (2.16), New Mexico (2.07), Texas (1.58), Maryland (1.44).
3. Nurse practitioners
The top states with the highest concentration of jobs in this field: Tennessee (2.36), Mississippi (1.89), New Hampshire (1.5), West Virginia (1.47), Arkansas (1.41), Missouri (1.4), South Carolina (1.33), Kentucky (1.33), Delaware (1.31), Indiana (1.16).
4. Data scientists
The top states with the highest concentration of jobs in this field: District of Columbia (3.48), Utah (1.66), Colorado (1.65), Rhode Island (1.46), California (1.46), Nebraska (1.4), New York (1.38), Washington (1.27), Texas (1.2), North Carolina (1.09).
5. Information security analysts
The top states with the highest concentration of jobs in this field: Virginia (4.01), Maryland (2.55), District of Columbia (1.97), New Mexico (1.72), Colorado (1.68), Delaware (1.54), New Jersey (1.36), North Carolina (1.32), Washington (1.22), Georgia (1.1).
6. Medical and health services managers
The top states with the highest concentration of jobs in this field: Maryland (1.63), Massachusetts (1.58), Arkansas (1.56), Montana (1.36), Mississippi (1,33), Alabama (1.33), Kentucky (1.27), Connecticut (1.24), Alaska (1.23), New Jersey (1.2).
7. Physician assistants
The top states with the highest concentration of jobs in this field: Connecticut (1.85), New York (1.85), North Carolina (1.78), Alaska (1.72), Pennsylvania (1.53), Idaho (1.48), New Hampshire (1.45), Montana (1.37), South Dakota (1.37), Delaware (1.35).
8. Computer and information research scientists
The top states with the highest concentration of jobs in this field: Rhode Island (4.03), Maryland (3.72), Washington (3.63), Virginia (2.53), Utah (2.09), District of Columbia (1.86), California (1.82), Oregon (1.76), Oklahoma (1.28), New Jersey (1.23), Mississippi (1.09).
9. Physical therapist assistants
The top states with the highest concentration of jobs in this field: Arkansas (1.83), Ohio (1.75), West Virginia (1.74), Rhode Island (1.51), Kentucky (1.49), New Mexico (1.48), Mississippi (1.43), Alabama (1.41), Kansas (1.4), Florida (1.39), Oklahoma (1.38).
10. Operations research analysts
The top states with the highest concentration of jobs in this field: District of Columbia (4.09), Virginia (2.5), Delaware (1.85), Maryland (1.79), Wisconsin (1.6), California (1.44), Missouri (1.38), Massachusetts (1.35), New Georgia (1.24), Oregon (1.23), Illinois (1.14).
11. Occupational therapy assistants
The top states with the highest concentration of jobs in this field: Rhode Island (2.35), Ohio (1.73), Illinois (1.62), Kansas (1.52), Texas (1.48), Mississippi (1.44), Oklahoma (1.41), Connecticut (1.4), Arkansas (1.24), Florida (1.34).
12. Actuaries
The top states with the highest concentration of jobs in this field: Connecticut (4.63), Iowa (2.8), District of Columbia (2.3), New Jersey (2.29), Minnesota (2.19), Wisconsin (2.02), Rhode Island (1.95), Pennsylvania (1.88), Illinois (1.85), New York (1.83), Colorado (1.59).
13. Financial examiners
The top states with the highest concentration of jobs in this field: Delaware (3.27), New York (2.78), Iowa (2.11), Rhode Island (2), New Jersey (1.96), Nebraska (1.88), Missouri (1.85), Ohio (1.75), Minnesota (1.62), District of Columbia (1.56).
14. Home health and personal care aides
The top states with the highest concentration of jobs in this field: New York (2.48), California (1.83), New Mexico (1.78), Minnesota (1.6), Pennsylvania (1.47), Maine (1.14), Massachusetts (1.28), Missouri (1.19), West Virginia (1.18), Wisconsin (1.07).
15. Veterinary assistants and laboratory animal caretakers
The top states with the highest concentration of jobs in this field: Maine (1.68), Oregon (1.68), Oklahoma (1.62), Washington (1.60), Montana (1.58), North Carolina (1.57), Virginia (1.55), Arkansas (1.35), Kansas (1.30), Maryland (1.25).
16. Veterinary technologists and technicians
The top states with the highest concentration of jobs in this field: Colorado (1.93), New Hampshire (1.88), Delaware (1.80), Vermont (1.77), Minnesota (1.76), Maine (1.72), Montana (1.62), Connecticut (1.41), Wyoming (1.38), Florida (1.34).
17. Logisticians
The top states with the highest concentration of jobs in this field: Alabama (1.83), Maryland (1.80), Michigan (1.77), Oklahoma (1.65), Virginia (1.55), Utah (1.39), Georgia (1.37), South Carolina (1.28), Pennsylvania (1.18), District of Columbia (1.18).
18. Veterinarians
The top states with the highest concentration of jobs in this field: Montana (1.90), Oregon (1.63), New Hampshire (1.54), Colorado (1.52), Maine (1.48), Oklahoma (1.39), Kansas (1.36), Missouri (1.31), Virginia (1.30), South Carolina (1.26), Wisconsin (1.22).
19. Substance abuse, behavioral disorder, and mental health counselors
The top states with the highest concentration of jobs in this field: Massachusetts (1.81), Colorado (1.79), Connecticut (1.60), Pennsylvania (1.54), Virginia (1.51), Montana (1.43), South Dakota (1.39), Alaska (1.37), Washington (1.32), Oregon (1.26), Kentucky (1.28).
20. Epidemiologists
The top states with the highest concentration of jobs in this field: Washington (3.98), Colorado (2.83), Maryland (2.50), Alaska (2.41), West Virginia (2.37), Massachusetts (2.34), Rhode Island (1.99), New Mexico (1.92), Montana (1.77), Georgia (1.59), Minnesota (1.44).
22. Health specialties teachers, postsecondary
The top states with the highest concentration of jobs in this field: Vermont (2.40), West Virginia (2.08), Pennsylvania (2.02), Maryland (1.92), Massachusetts (1.85), New York (1.59), North Carolina (1.53), New Mexico (1.51), Nebraska (1.48), Oregon (1.45), Utah (1.39), Missouri (1.28), Texas (1.27).
23. Speech-language pathologists
The top states with the highest concentration of jobs in this field: New York (1.56), Arkansas (1.55), Louisiana (1.33), North Dakota (1.30), Colorado (1.27), New Jersey (1.25), Texas (1.22), Illinois (1.21), Mississippi (1.20), Kentucky (1.16).
24. Medical equipment repairers
The top states with the highest concentration of jobs in this field: South Dakota (2.17), Minnesota (1.74), Ohio (1.72), Kansas (1.55), North Carolina (1.52), Rhode Island (1.47), West Virginia (1.41), Iowa (1.36), Texas (1.36), North Dakota (1.29), and Maryland (1.28).
25. Software developers
The top states with the highest concentration of jobs in this field: Washington (2.34), Virginia (2.0), California (1.55), Massachusetts (1.51), Colorado (1.47), Utah (1.42), New Hampshire (1.26), Minnesota (1.23), New Jersey (1.19), and North Carolina (1.12).
26. Nursing instructors and teachers, postsecondary
The top states with the highest concentration of jobs in this field: Hawaii (1.81), Connecticut (1.46), Arkansas (1.47), New Hampshire (1.4), Pennsylvania (1.4), Kentucky (1.36), Mississippi (1,34), Alaska (1,29), Alabama (1.25).
27. Massage therapists
The top states with the highest concentration of jobs in this field: Colorado (2.53), Nevada (2.38), Alaska (2.22), Oregon (1.96), Utah (1.86), Washington (1.65), Florida (1.53), Arizona (1.52), Montana (1.17), Connecticut (1.15).
28. Computer and information systems managers
The top states with the highest concentration of jobs in this field: Massachusetts (1.76), New Jersey (1.7), District of Columbia (1.66), Connecticut (1.54), California (1.41), Maryland (1.3), Nebraska (1.29), New Hampshire (1.24), Washington (1.22), Texas (1.18), North Carolina (1.16).
29. Industrial machinery mechanics
The top states with the highest concentration of jobs in this field: Alabama (2.93), Wyoming (2.68), North Dakota (2.31), Wisconsin (2.14), Arkansas (2.13), Indiana (2.06), Michigan (1.71), Kentucky (1.66), West Virginia (1.63), Mississippi (1.62), South Carolina (1.52), Kansas (1.5), Iowa (1.5).
30. Personal financial advisors
The top states with the highest concentration of jobs in this field: New Hampshire (1.74), North Carolina (1.69), New York (1.63), Massachusetts (1.35), Kansas (1.31), Connecticut (1.22), Florida (1.22), Maryland (1.19), Minnesota (1.17), New Jersey (1.10).
Psychiatric technicians
The top states with the highest concentration of jobs in this field: Hawaii (3.52), Arizona (2.90), Indiana (2.24), Vermont (1.99), Idaho (1.91), Wisconsin (1.79), Alaska (1.71), Missouri (1.69), Florida (1.68), Michigan (1.62), Rhode Island (1.58).
Cost of Living: Cheapest and Priciest States in the U.S.
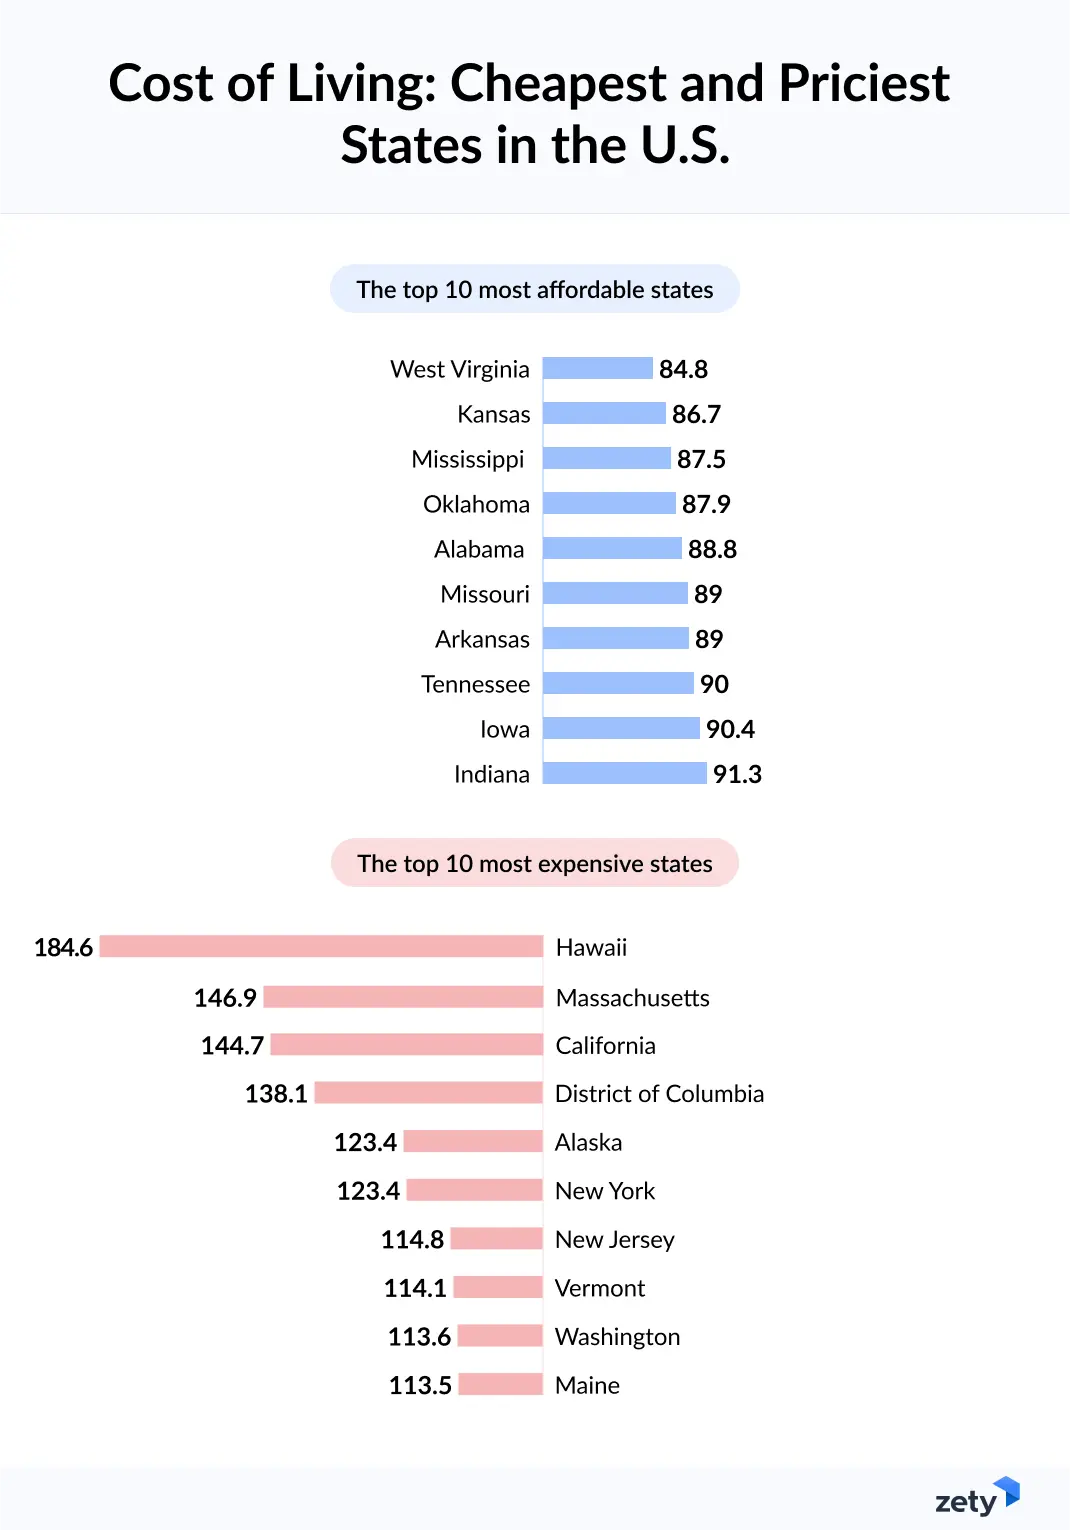
The cost of living index compares the expenses of living in different areas. The average cost for all 273 areas is set at 100. A score above 100 means living costs are higher than average, while a score below 100 means living expenses are lower.
The ten most affordable states are West Virginia, Kansas, Mississippi, Oklahoma, Alabama, Missouri, Arkansas, Tennessee, Iowa, and Indiana. On the other hand, the cost of living is highest in Hawaii, Massachusetts, California, the District of Columbia, Alaska, New York, New Jersey, Vermont, Washington, and Maine.
The top 10 most affordable states in the U.S.
| Index | Grocery | Housing | Utilities | Transportation | Health | Other goods & services | ||
| West Virginia | 84.8 | 98.4 | 61.3 | 96.4 | 93.1 | 96.8 | 91.2 | |
| Kansas | 86.7 | 94.6 | 70.7 | 100.8 | 92.2 | 92.6 | 90.3 | |
| Mississippi | 87.5 | 96.8 | 72.2 | 89.4 | 90.1 | 95.6 | 93.8 | |
| Oklahoma | 87.9 | 96.5 | 74.7 | 96.5 | 90.6 | 99.3 | 90.5 | |
| Alabama | 88.8 | 97.8 | 71.4 | 100.5 | 90.3 | 90.1 | 95.8 | |
| Missouri | 89 | 97 | 78.6 | 98 | 88.3 | 91.6 | 91.7 | |
| Arkansas | 89 | 95.5 | 75.2 | 90.4 | 91.5 | 85.8 | 97.1 | |
| Tennessee | 90 | 97.1 | 82.8 | 86 | 88.1 | 87.6 | 94.8 | |
| Iowa | 90.4 | 96.5 | 75.4 | 92.9 | 98.2 | 96.7 | 96.3 | |
| Indiana | 91.3 | 97 | 77.3 | 92.1 | 101.6 | 97.7 | 96.1 |
Exemplary job roles with the best fit for affordable states:
- Wind turbine service technicians: Oklahoma, Kansas.
- Physical therapist assistants: Mississippi, Kansas.
- Medical equipment repairers: West Virginia, Iowa.
- Industrial machinery mechanics: Alabama, Mississippi, Arkansas, Indiana.
- Nurse practitioners: Tennessee, Mississippi, West Virginia.
- Personal financial advisors: Kansas.
These job roles are particularly well-suited for affordable states due to the combination of growing demand, competitive wages, and lower living costs.
The top 10 most expensive states in the U.S.
| Index | Grocery | Housing | Utilities | Transportation | Health | Other goods & services | ||
| Hawaii | 184.6 | 135.9 | 302.6 | 210 | 133.7 | 123.7 | 124.9 | |
| Massachusetts | 146.9 | 104.5 | 226 | 146.1 | 109.5 | 130.1 | 113.6 | |
| California | 144.7 | 112.4 | 209.1 | 137.7 | 130.2 | 106.5 | 116.8 | |
| District of Columbia | 138.1 | 104.7 | 213 | 100.5 | 108.4 | 114.8 | 112.5 | |
| Alaska | 123.4 | 125.1 | 117.8 | 157.4 | 115.7 | 146.4 | 117.6 | |
| New York | 123.4 | 103.8 | 170.2 | 97.5 | 108.3 | 111.6 | 105.9 | |
| New Jersey | 114.8 | 103.6 | 138.2 | 100.7 | 106.4 | 106.7 | 107.6 | |
| Vermont | 114.1 | 106.4 | 133.1 | 110.7 | 95.4 | 113.3 | 108.5 | |
| Washington | 113.6 | 103.5 | 126.7 | 94.4 | 119.9 | 116.4 | 109.7 | |
| Maine | 113.5 | 101.4 | 135.8 | 111 | 107.7 | 112.9 | 102.6 |
If you’re considering relocating to a state with a higher cost of living, explore these career opportunities:
- Computer and information research scientists: District of Columbia, California, New Jersey.
- Software Developers: Washington, California, Massachusetts.
- Physician assistants: New York.
- Information security analysts: District of Columbia, New Jersey, Washington.
At the same time, these roles are among the better-paying careers, offering the potential to comfortably cover living expenses while enjoying the benefits of a higher salary.
Methodology
- Our primary source was the US Bureau of Labor Statistics occupational employment projections for 2023 and projected 2033.
- To discover the best states for the particular professor, we calculated the ratio between the annual salary and the cost of living index for a given profession in each state. Next, we multiplied this ratio by the metric of job openings for that profession per 1,000 listings in the state. The higher the final score, the better the state is for that specific profession.
- The Missouri Economic Research and Information Center proposes the Cost of Living Index, which derives each state’s cost of living index by averaging the indices of participating cities and metropolitan areas. The composite index is based on six components: housing, utilities, grocery items, transportation, health care, and miscellaneous goods and services. The national average for all 273 participating areas is given a benchmark of 100.
Sources
- Missouri Economic Research and Information Center, “Cost of Living Data Series”
- North American Moving Services, “National Movers Study”
- U.S. Bureau of Labor Statistics, “May 2023 State Occupational Employment and Wage Estimates”
- U.S. Bureau of Labor Statistics, “Fastest growing occupations”
- United States Census Bureau, “Number and Percentage of State-to-State Movers Increased Between 2021 and 2022”
Share: